| Japanese | English |

24th LSI Design Contests-in Okinawa Design Specification - 4-3
4-3.Learning results
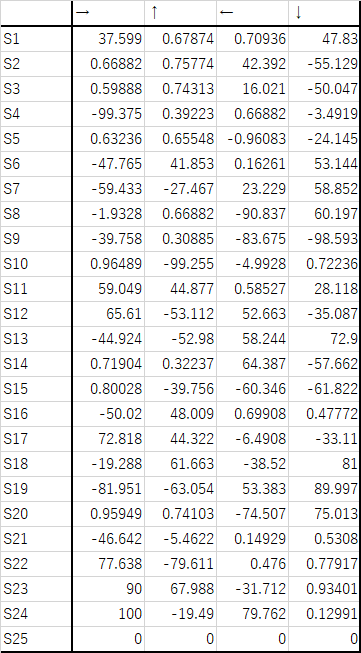
The Q value table after actual learning is shown below.
Table 2 : Q-value table after learning

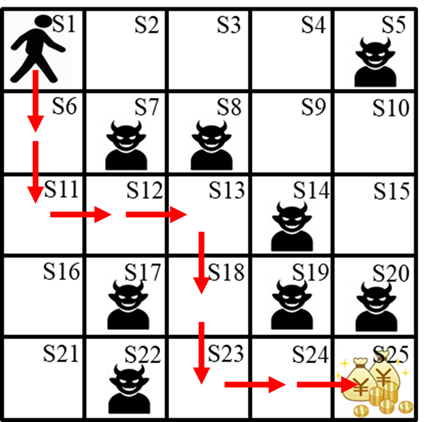
Referring to Table 2, the route taken when an agent selects an action is shown in Fig. 3 below.

Fig 3 : Agent's path
Figure 3 shows that they are learning how to get money without going through the devil trout.
The following is a pdf summarizing Q-learning.
pdf file:Q-learning.pdf
Copyright (C) 2020-2021 LSI Design Contest. All Rights Reserved.